
页面加载中,请稍候
来源:开源Linux发布时间:2022-05-05645浏览
询问 AI
来自:分布式实验室

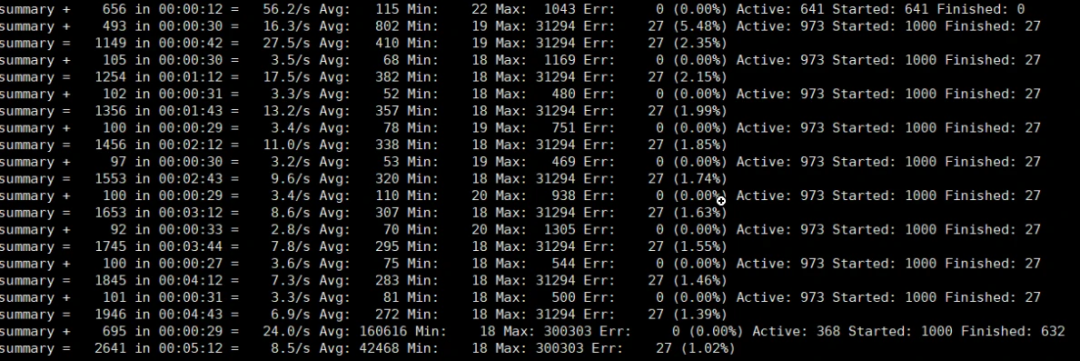
整理结果时比较浪费时间。
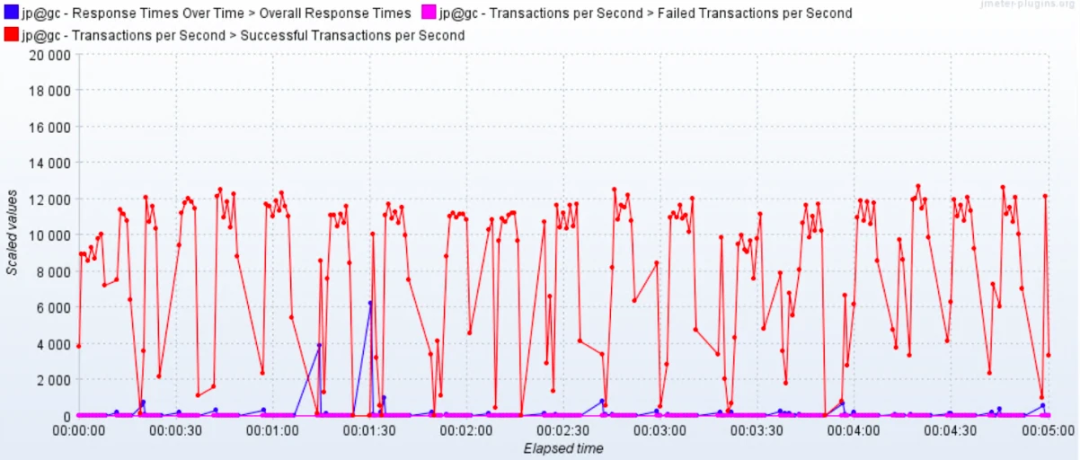
在 GUI 用插件看曲线,做高并发时并不现实。
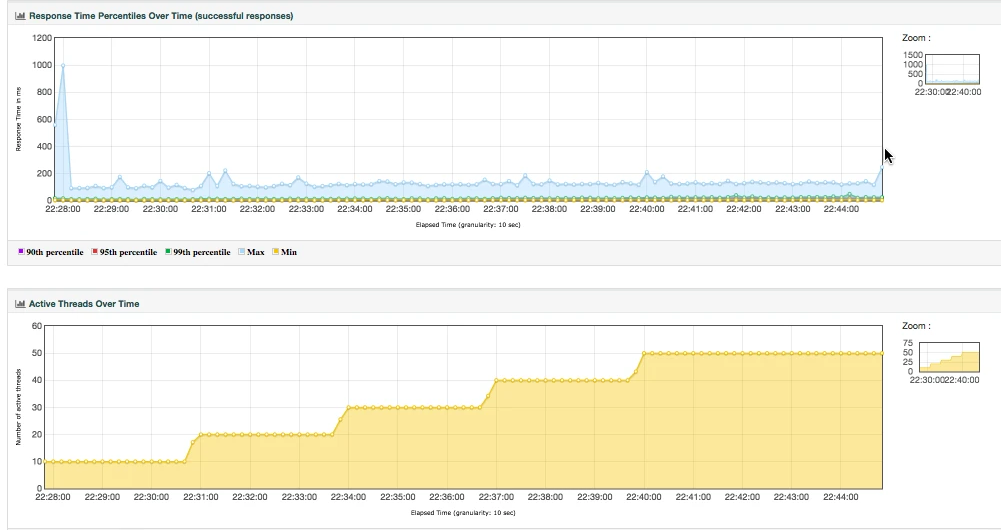
在场景运行时间比较长的时候,采用生成 HTML 的方式,会出现消耗内存过大的情况,而实际上,在生成的结果图中,有很多生成的图我们并不是那么关注。
生成的结果保存之后再查看比较麻烦,还要一个个去找。
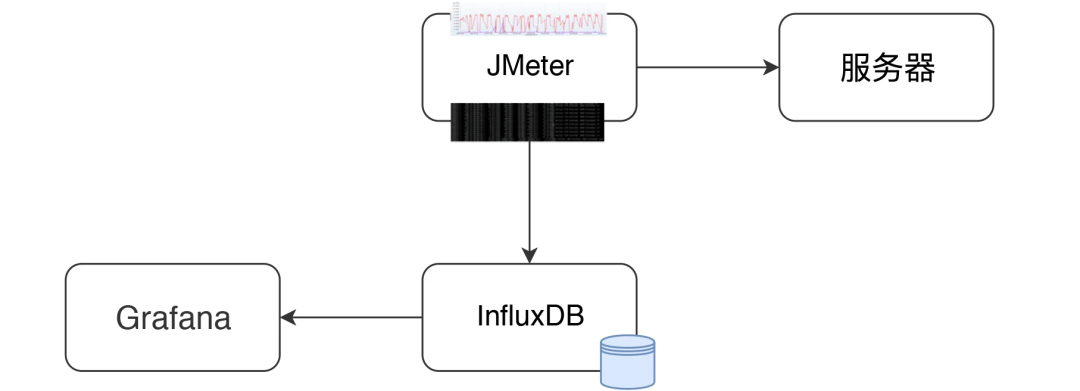
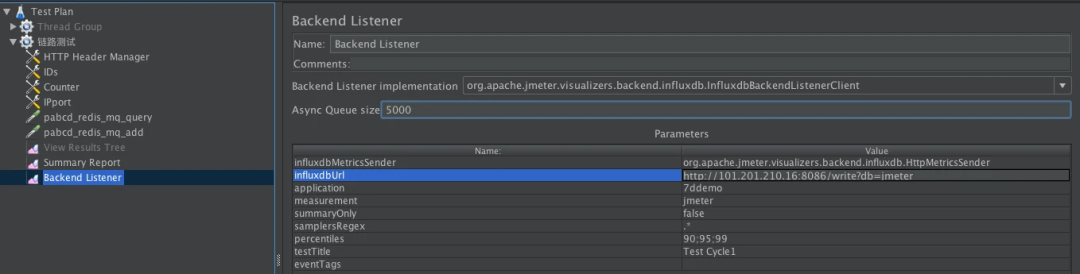
从这段代码可以看出,站在全局统计的视角来看,这里把 JMeter 运行的统计结果,比如事务的 Total 请求、发送接收字节、平均值、最大值、最小值等,都加到 metric 中,同时也会把成功和失败的事务信息添加到 metric 中去。private void addMetrics(String transaction, SamplerMetric metric) {
// FOR ALL STATUS
addMetric(transaction, metric.getTotal(), metric.getSentBytes(), metric.getReceivedBytes(), TAG_ALL, metric.getAllMean(), metric.getAllMinTime(),
metric.getAllMaxTime(), allPercentiles.values(), metric::getAllPercentile);
// FOR OK STATUS
addMetric(transaction, metric.getSuccesses(), null, null, TAG_OK, metric.getOkMean(), metric.getOkMinTime(),
metric.getOkMaxTime(), okPercentiles.values(), metric::getOkPercentile);
// FOR KO STATUS
addMetric(transaction, metric.getFailures(), null, null, TAG_KO, metric.getKoMean(), metric.getKoMinTime(),
metric.getKoMaxTime(), koPercentiles.values(), metric::getKoPercentile);
metric.getErrors().forEach((error, count) -> addErrorMetric(transaction, error.getResponseCode(),
error.getResponseMessage(), count));
}
通过 writeAndSendMetrics,就将所有保存的 metrics 都发给了 InfluxDB。@Override public void writeAndSendMetrics() {
........ if (!copyMetrics.isEmpty()) { try { if(httpRequest == null) {
httpRequest = createRequest(url);
}
StringBuilder sb = new StringBuilder(copyMetrics.size()*35); for (MetricTuple metric : copyMetrics) { // Add TimeStamp in nanosecond from epoch ( default in InfluxDB )
sb.append(metric.measurement)
.append(metric.tag)
.append(" ") //$NON-NLS-1$
.append(metric.field)
.append(" ")
.append(metric.timestamp+"000000")
.append("\n"); //$NON-NLS-1$
}
StringEntity entity = new StringEntity(sb.toString(), StandardCharsets.UTF_8);
httpRequest.setEntity(entity);
lastRequest = httpClient.execute(httpRequest, new FutureCallback<HttpResponse>() {
@Override public void completed(final HttpResponse response) { int code = response.getStatusLine().getStatusCode(); /* * HTTP response summary 2xx: If your write request received
* HTTP 204 No Content, it was a success! 4xx: InfluxDB
* could not understand the request. 5xx: The system is
* overloaded or significantly impaired. */
if (MetricUtils.isSuccessCode(code)) { if(log.isDebugEnabled()) {
log.debug("Success, number of metrics written: {}", copyMetrics.size());
}
} else {
log.error("Error writing metrics to influxDB Url: {}, responseCode: {}, responseBody: {}", url, code, getBody(response));
}
}
@Override public void failed(final Exception ex) {
log.error("failed to send data to influxDB server : {}", ex.getMessage());
}
@Override public void cancelled() {
log.warn("Request to influxDB server was cancelled");
}
});
........
}
}
}
> show databases这段代码也就是说,在 InfluxDB 中,创建了两个 MEASUREMENTS,分别是 events 和 jmeter。这两个各自存了数据,我们在界面中配置的 testtile 和 eventTags 放在了 events 这个 MEASUREMENTS 中。在模板中这两个值暂时都是不用的。
name: databases
name
----
_internal
jmeter
> use jmeter
Using database jmeter
>
> show MEASUREMENTS
name: measurements
name
----
events
jmeter
> select * from events where application='7ddemo'
name: events
time application text title
---- ----------- ---- -----
1575255462806000000 7ddemo Test Cycle1 started ApacheJMeter
1575256463820000000 7ddemo Test Cycle1 ended ApacheJMeter
..............
n> select * from jmeter where application='7ddemo' limit 10
name: jmeter
time application avg count countError endedT hit max maxAT meanAT min minAT pct90.0 pct95.0 pct99.0 rb responseCode responseMessage sb startedT statut transaction
---- ----------- --- ----- ---------- ------ --- --- ----- ------ --- ----- ------- ------- ------- -- ------------ --------------- -- -------- ------ -----------
1575255462821000000 7ddemo 0 0 0 0 0 internal
1575255467818000000 7ddemo 232.82352941176472 17 0 17 849 122 384.9999999999996 849 849 0 0 all all
1575255467824000000 7ddemo 232.82352941176472 17 849 122 384.9999999999996 849 849 0 0 all 0_openIndexPage
1575255467826000000 7ddemo 232.82352941176472 17 849 122 384.9999999999996 849 849 ok 0_openIndexPage
1575255467829000000 7ddemo 0 1 1 1 1 internal
1575255472811000000 7ddemo 205.4418604651163 26 0 26 849 122 252.6 271.4 849 0 0 all all
1575255472812000000 7ddemo 0 1 1 1 1 internal
1575255472812000000 7ddemo 205.4418604651163 26 849 122 252.6 271.4 849 ok 0_openIndexPage
1575255472812000000 7ddemo 205.4418604651163 26 849 122 252.6 271.4 849 0 0 all 0_openIndexPage
1575255477811000000 7ddemo 198.2142857142857 27 0 27 849 117 263.79999999999995 292.3500000000001 849 0 0 all all
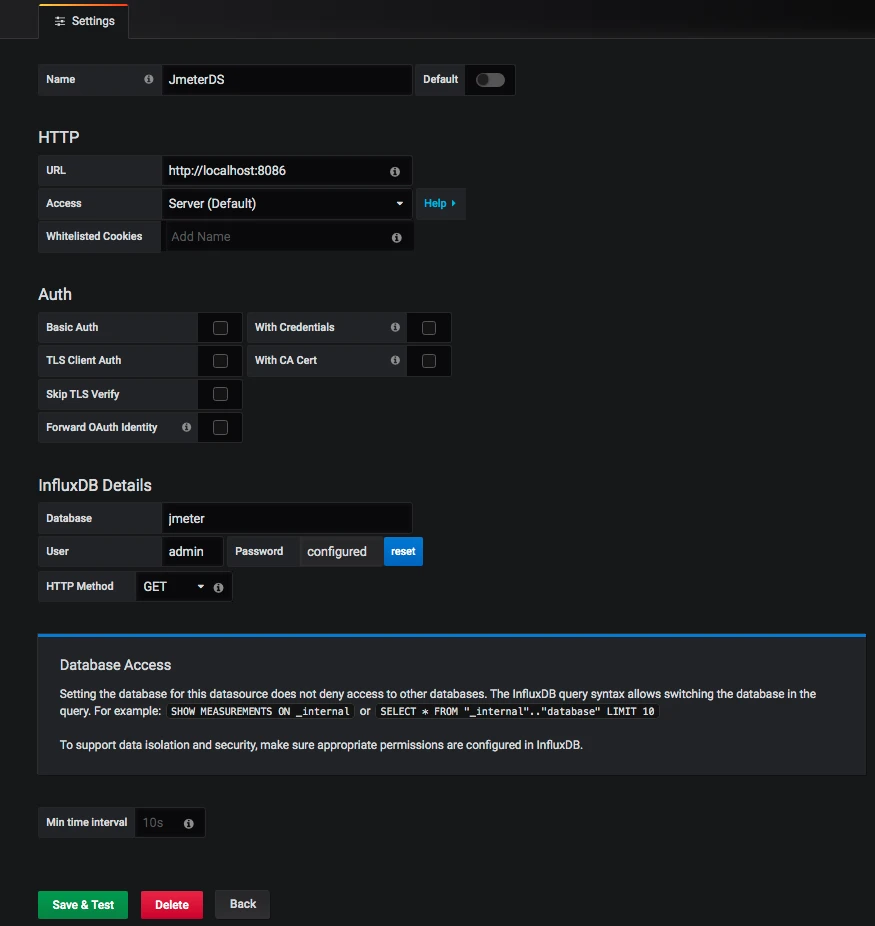
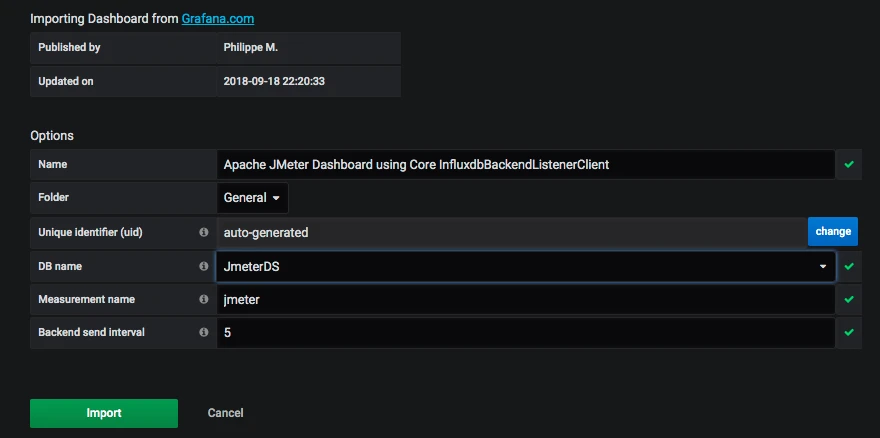
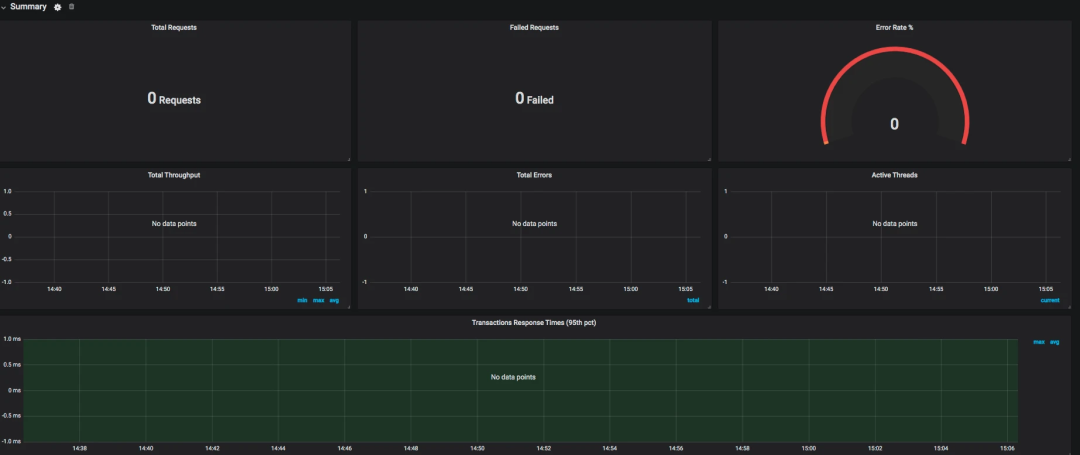
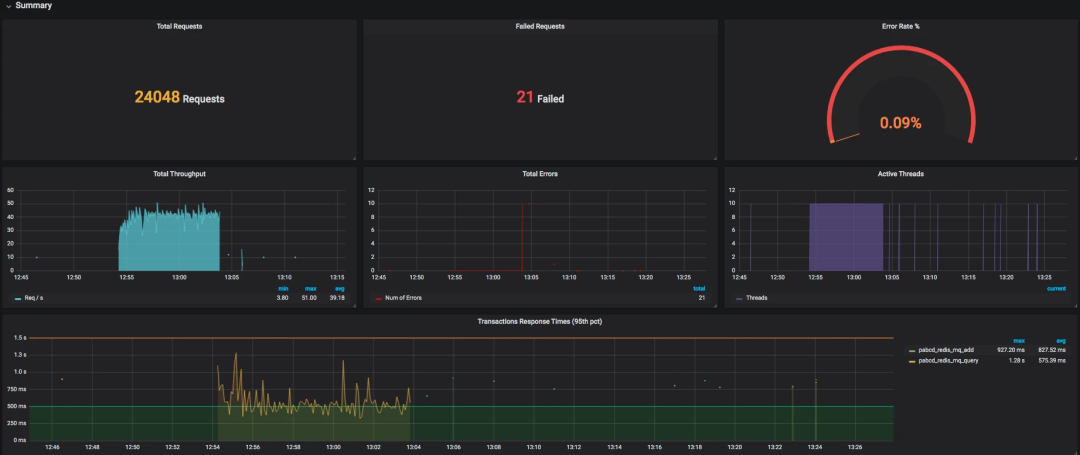
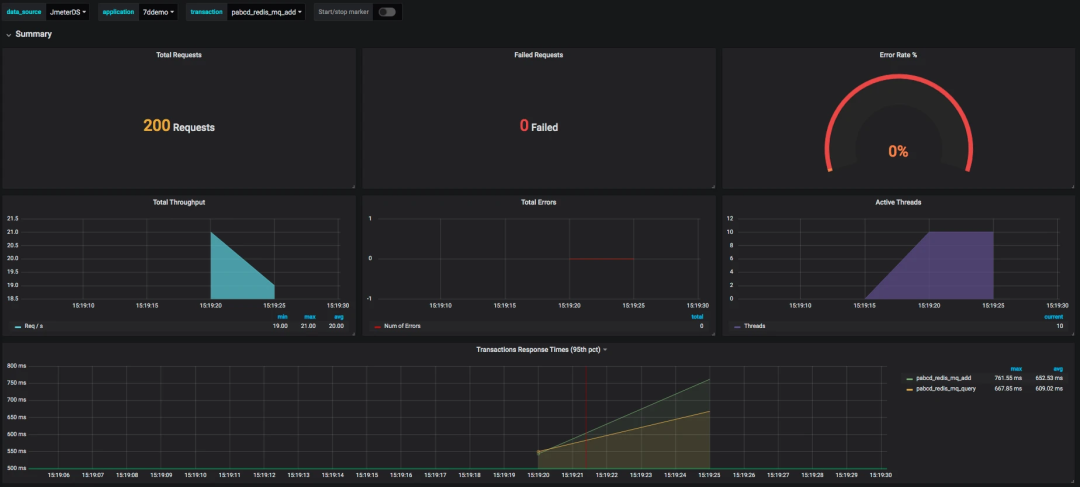
上面这个就是 Total TPS 了,在这里称为 throughput。SELECT last("count") / $send_interval FROM "$measurement_name" WHERE ("transaction" =~ /^$transaction$/ AND "statut" = 'ok') AND $timeFilter GROUP BY time($__interval)
SELECT mean("pct95.0") FROM "$measurement_name" WHERE ("application" =~ /^$application$/) AND $timeFilter GROUP BY "transaction", time($__interval) fill(null)

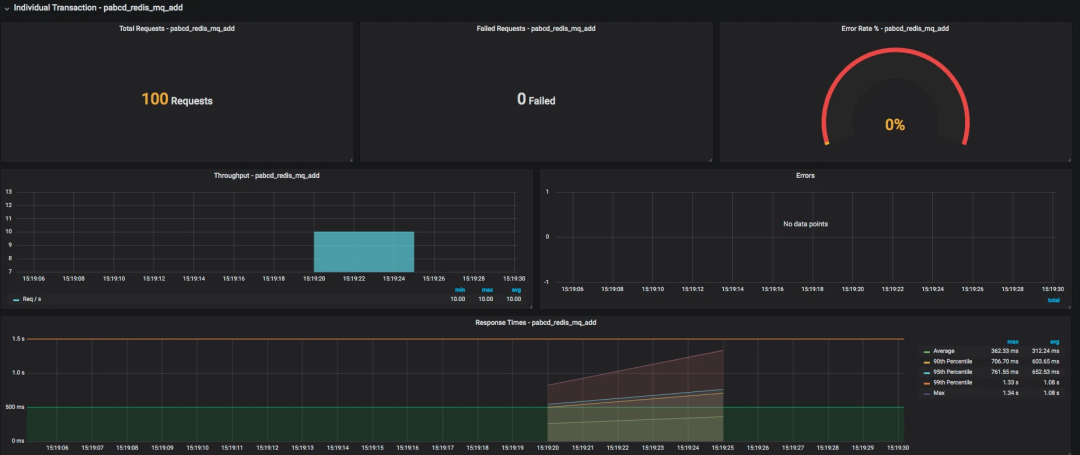
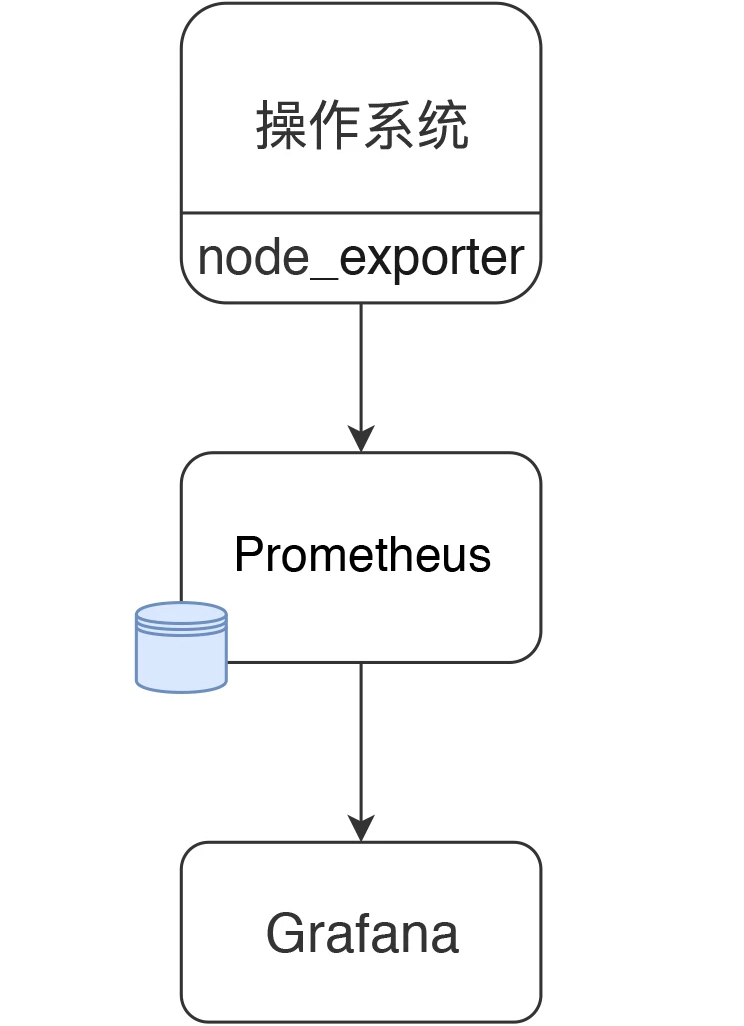
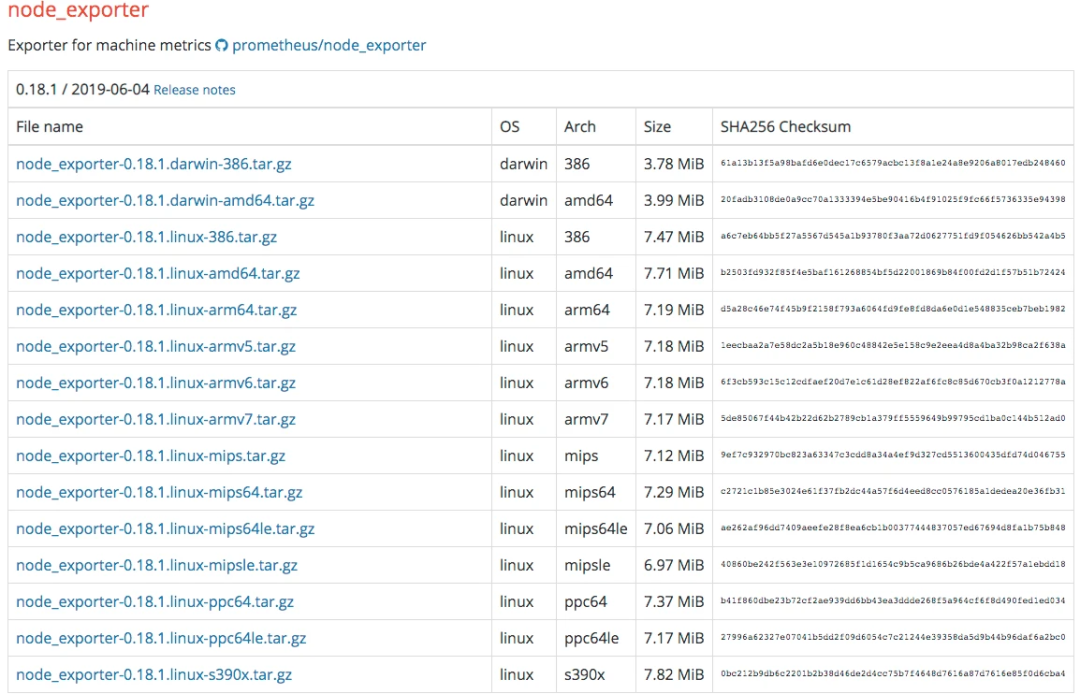
启动:[root@7dgroup2 node_exporter-0.18.1.linux-amd64]# ll
total 16524
-rw-r--r-- 1 3434 3434 11357 Jun 5 00:50 LICENSE
-rwxr-xr-x 1 3434 3434 16878582 Jun 5 00:41 node_exporter
-rw-r--r-- 1 3434 3434 463 Jun 5 00:50 NOTICE}
是不是很简洁?如果想看更多的功能 ,可以查看下它的帮助。[root@7dgroup2 node_exporter-0.18.1.linux-amd64]#./node_exporter --web.listen-address=:9200 &
解压之后,我们可以看到目录结构如下:[root@7dgroup2 data]# wget -c https://github.com/prometheus/prometheus/releases/download/v2.14.0/prometheus-2.14.0.linux-amd64.tar.gz
..........
100%[=============================================================================================>] 58,625,125 465KB/s in 6m 4s
2019-11-29 15:40:16 (157 KB/s) - ‘prometheus-2.14.0.linux-amd64.tar.gz’ saved [58625125/58625125]
[root@7dgroup2 data]
在prometheus.yml中添加如下配置,以取数据:[root@7dgroup2 prometheus-2.11.1.linux-amd64]# ll
total 120288
drwxr-xr-x. 2 3434 3434 4096 Jul 10 23:26 console_libraries
drwxr-xr-x. 2 3434 3434 4096 Jul 10 23:26 consoles
drwxr-xr-x. 3 root root 4096 Nov 30 12:55 data
-rw-r--r--. 1 3434 3434 11357 Jul 10 23:26 LICENSE
-rw-r--r--. 1 root root 35 Aug 7 23:19 node.yml
-rw-r--r--. 1 3434 3434 2770 Jul 10 23:26 NOTICE
-rwxr-xr-x. 1 3434 3434 76328852 Jul 10 21:53 prometheus
-rw-r--r-- 1 3434 3434 1864 Sep 21 09:36 prometheus.yml
-rwxr-xr-x. 1 3434 3434 46672881 Jul 10 21:54 promtool
[root@7dgroup2 prometheus-2.11.1.linux-amd64]#
启动:- job_name: 's1'
static_configs:
- targets: ['172.17.211.143:9200']
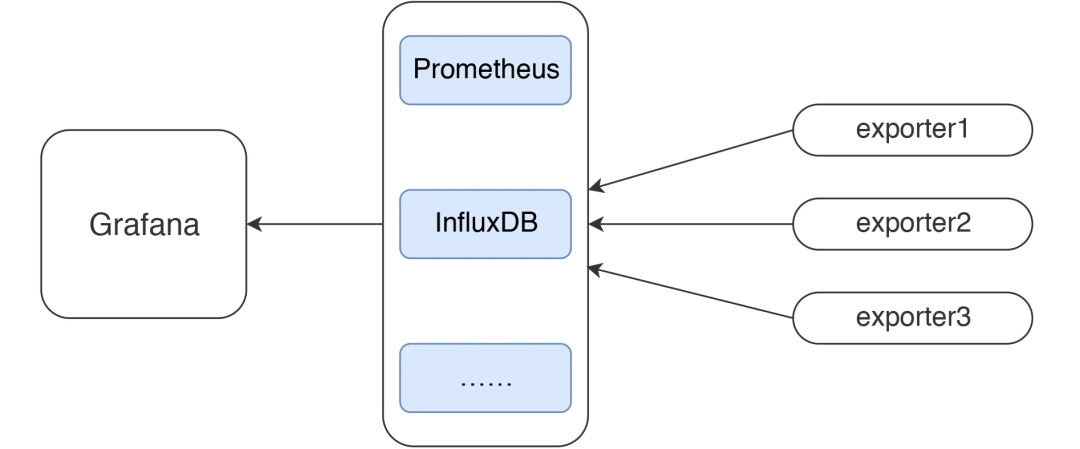
这样就行了吗?当然不是。根据上面的流程图,我们还需要配置 Grafana。[root@7dgroup2 data]# ./prometheus --config.file=prometheus.yml &
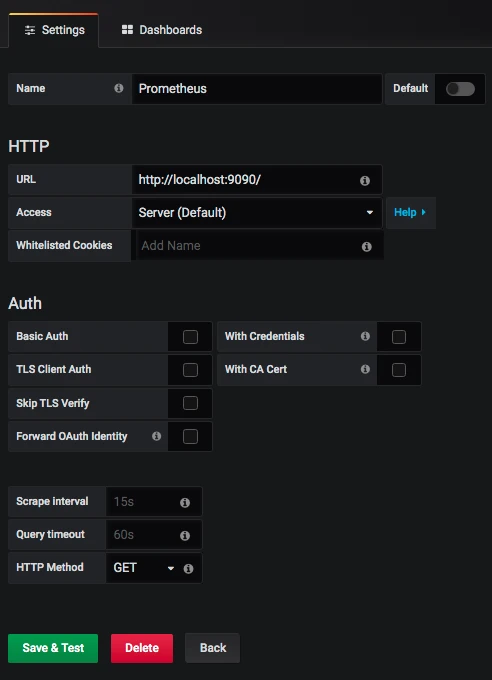
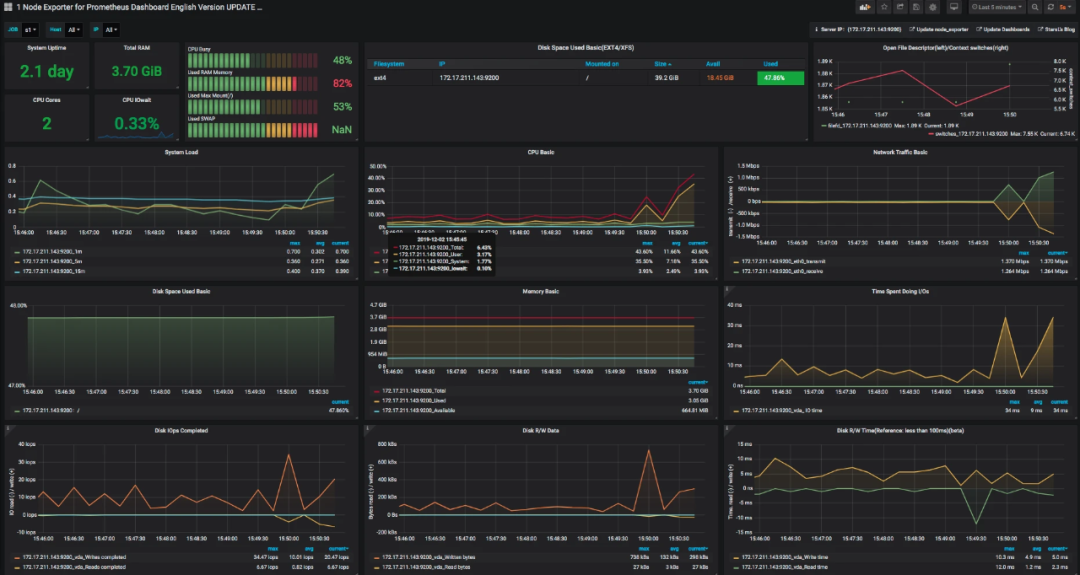
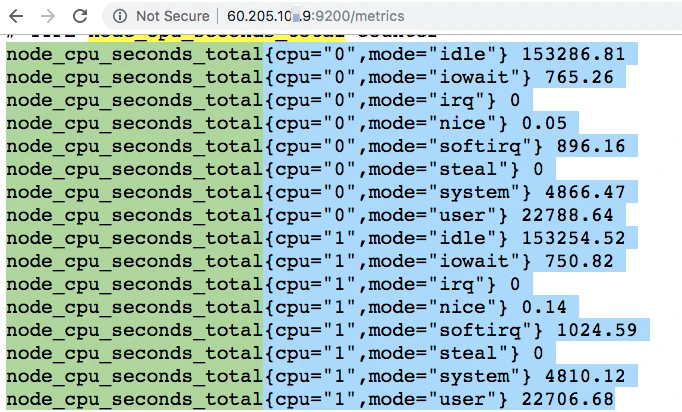
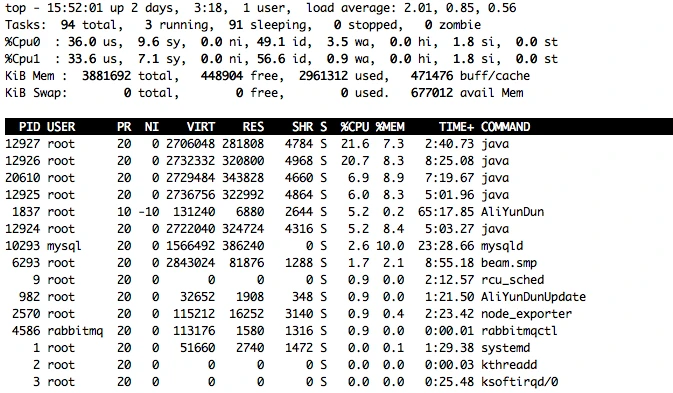
这些都是从 Prometheus 中取出来的数据,查询语句读了 Prometheus 中node_cpu_seconds_total的不同的模块数据。avg(irate(node_cpu_seconds_total{instance=~"$node",mode="system"}[30m])) by (instance) avg(irate(node_cpu_seconds_total{instance=~"$node",mode="user"}[30m])) by (instance) avg(irate(node_cpu_seconds_total{instance=~"$node",mode="iowait"}[30m])) by (instance) 1 - avg(irate(node_cpu_seconds_total{instance=~"$node",mode="idle"}[30m])) by (instance)
新闻来源:开源Linux,文中所述为作者独立观点,不代表icspec立场。更多精彩资讯请下载icspec App。如对本稿件有异议,请联系微信客服specltkj。
暂无评论哦,快来评论一下吧!

2026-06-03

2026-07-02

2026-06-02